
Employee Listening & Culture Data
Portfolio Intelligence: The People Metrics Private Equity Firms Should Be Monitoring
Paradigm
·

A framework for operating partners and portfolio-level people leaders who want cross-portfolio people visibility without requiring every portfolio company to standardize their HR stack.
In a closed-door session with one of Europe’s largest private equity (PE) firms, an operating partner asked us a simple question: “Can we compare portfolio companies on people metrics without forcing every company onto the same HR platform?”
Over the following two months, the same question came up in conversations with two more private equity firms. Historically, the honest answer was no, at least not at scale. Cross-portfolio people benchmarking required manual data collection, spreadsheet normalization, and significant effort every reporting cycle.
That answer is starting to change. This playbook explores what PE firms should be benchmarking across their portfolios, why cross-portfolio comparison has been so difficult, and what becomes possible when people data is as accessible as financial data at the portfolio level.
Your Portfolio Companies Have More People Risk Than Your Financials Show
PE firms are sophisticated monitors of financial performance. Operating partners track EBITDA, margin trends, working capital efficiency, and revenue growth with mature infrastructure and consistent processes. The quarterly board pack shows these numbers in a format that’s comparable across companies and actionable at the portfolio level.
People performance is different. The leading indicators that predict whether a portfolio company will hit its operational targets are still difficult to compare across a portfolio. Attrition is reported inconsistently, if at all. Engagement data stays at the company level. Culture metrics rarely appear in board materials unless someone specifically asks for them and someone else has the time to pull the data together.
In conversations with three PE firms with very different portfolio compositions, we saw the same challenge surface repeatedly: cross-portfolio culture benchmarking remains largely a manual spreadsheet exercise. Different systems, different definitions, and no reliable way to benchmark companies against one another without significant effort.
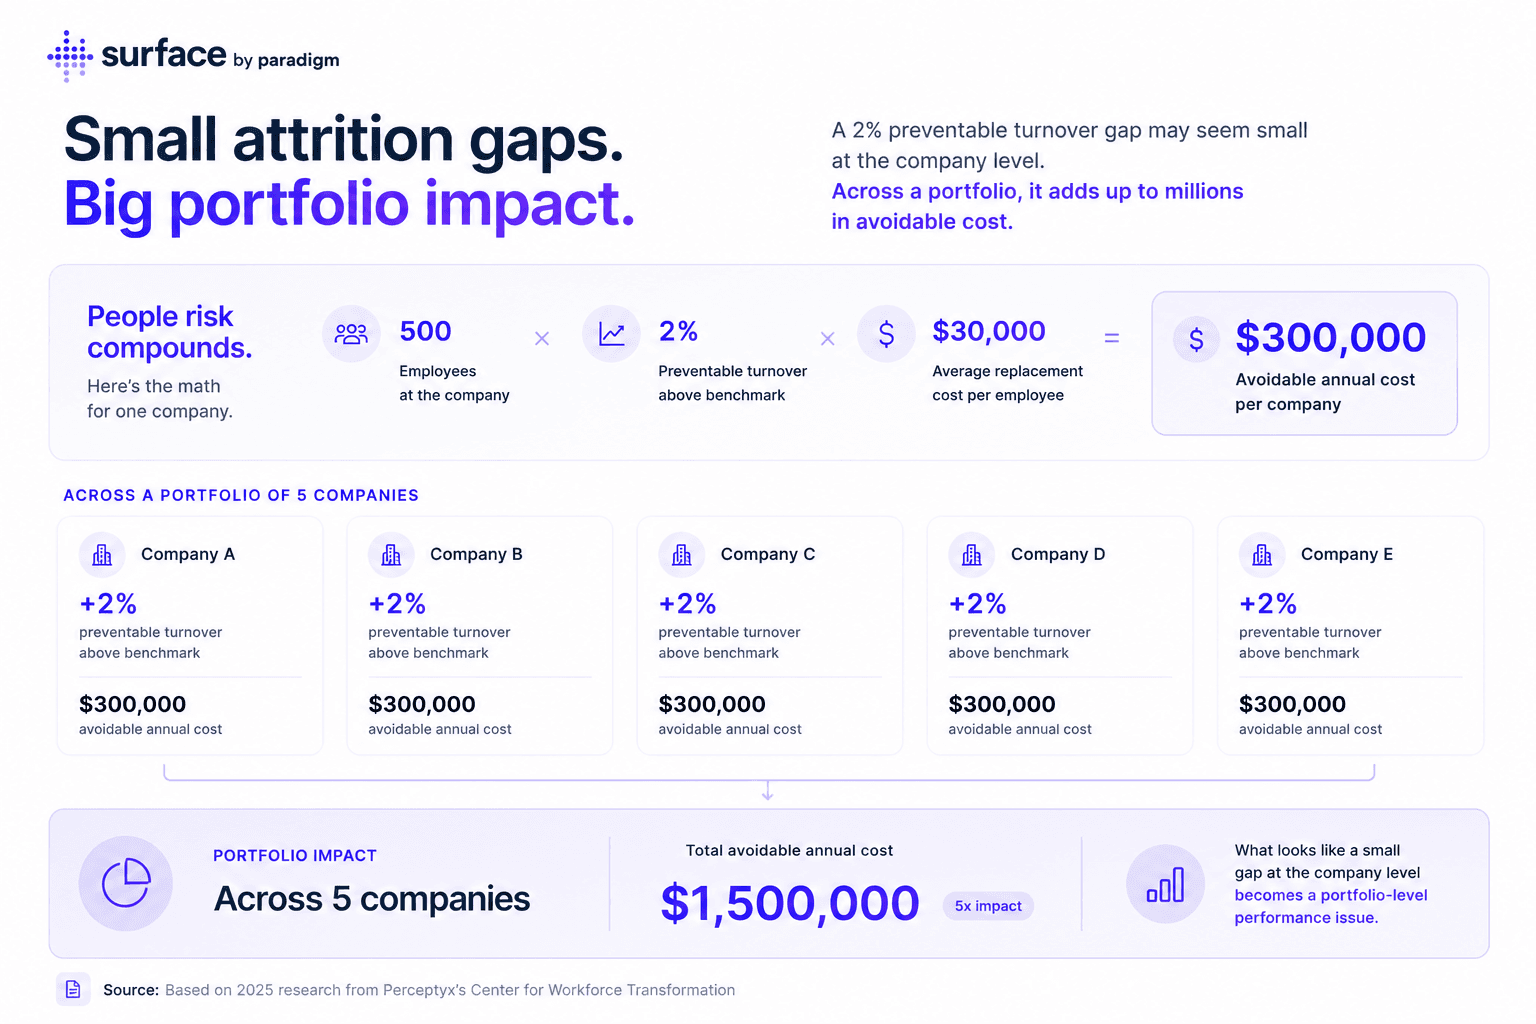
The cost is measurable. If the average replacement cost for an employee is $30,000 and a 500-person portfolio company has 2% preventable turnover above peer benchmarks, that’s $300,000 in avoidable annual cost.
That’s one company. Multiply that across an entire portfolio and people risk starts to look a lot like a portfolio-level performance issue.
Why Cross-Portfolio Benchmarking Is Hard
The problem persists for a structural reason: every portfolio company runs its own HR tech stack. These differences reflect what was in place pre-acquisition, leadership preferences, and company stage. The tools themselves aren’t the problem. They’re just different, which makes cross-portfolio comparison difficult.
Comparing people metrics across the portfolio means manually extracting data from each system, normalizing it into a consistent format, and rebuilding the comparison from scratch every quarter. Even PE firms with dedicated talent operating teams find that this doesn’t scale, and most firms don’t have dedicated talent operating teams.
The two obvious alternatives each create a different problem:
Force tool standardization: Require every portfolio company to adopt the same HR platform. The benefit is more consistent reporting, but the tradeoff is costly migrations, lengthy implementation timelines, and significant disruption across the portfolio.
Accept limited visibility: Leave each portfolio company on its existing systems and collect people data as needed. The benefit is minimal disruption, but the tradeoff is limited visibility into people risk and no reliable way to compare companies at the portfolio level.
Neither option is particularly attractive. One creates operational disruption. The other leaves operating partners without the portfolio-wide context needed to identify risks, benchmark performance, and prioritize action.
5 People Metrics That Predict Operational Outcomes
These metrics are leading indicators that reveal people risks before those risks show up in revenue growth, delivery timelines, customer outcomes, or quarterly financial results.
Tracking them across your portfolio helps you identify emerging issues earlier and focus your attention where it can have the greatest impact.
1. Attrition Rate: By Level, Function, and Tenure Band
Overall attrition is one of the most commonly reported people metrics and one of the least useful. A company with 8% overall attrition can appear stable, while 22% of first-year engineers leave within 12 months. That’s a cost and continuity problem that may not appear in financial results until much later.
The cuts that matter are:
Regrettable attrition at senior levels
First-year attrition as a leading indicator of onboarding effectiveness and culture fit
Function-level attrition in high-value roles where turnover is most costly and hardest to replace
Early turnover in critical functions often predicts delivery delays, hiring pressure, and slower execution on operational initiatives. By the time those costs appear in financial reporting, they’ve already been incurred.
2. Manager Effectiveness Scores
Manager effectiveness is one of the strongest leading indicators of retention and engagement. Gallup’s 2024 research found that 42% of employees who voluntarily left their organization believed their manager or employer could have done something to prevent their departure.
That makes manager effectiveness more than a leadership metric. It gives you visibility into the layer of the organization that often determines whether talent stays, develops, or leaves. If manager effectiveness scores are declining, an attrition problem may be developing long before turnover appears in board reporting.
3. Belonging and Inclusion Metrics
Belonging metrics are often treated solely as a values measure. But they’re also a retention and productivity measure.
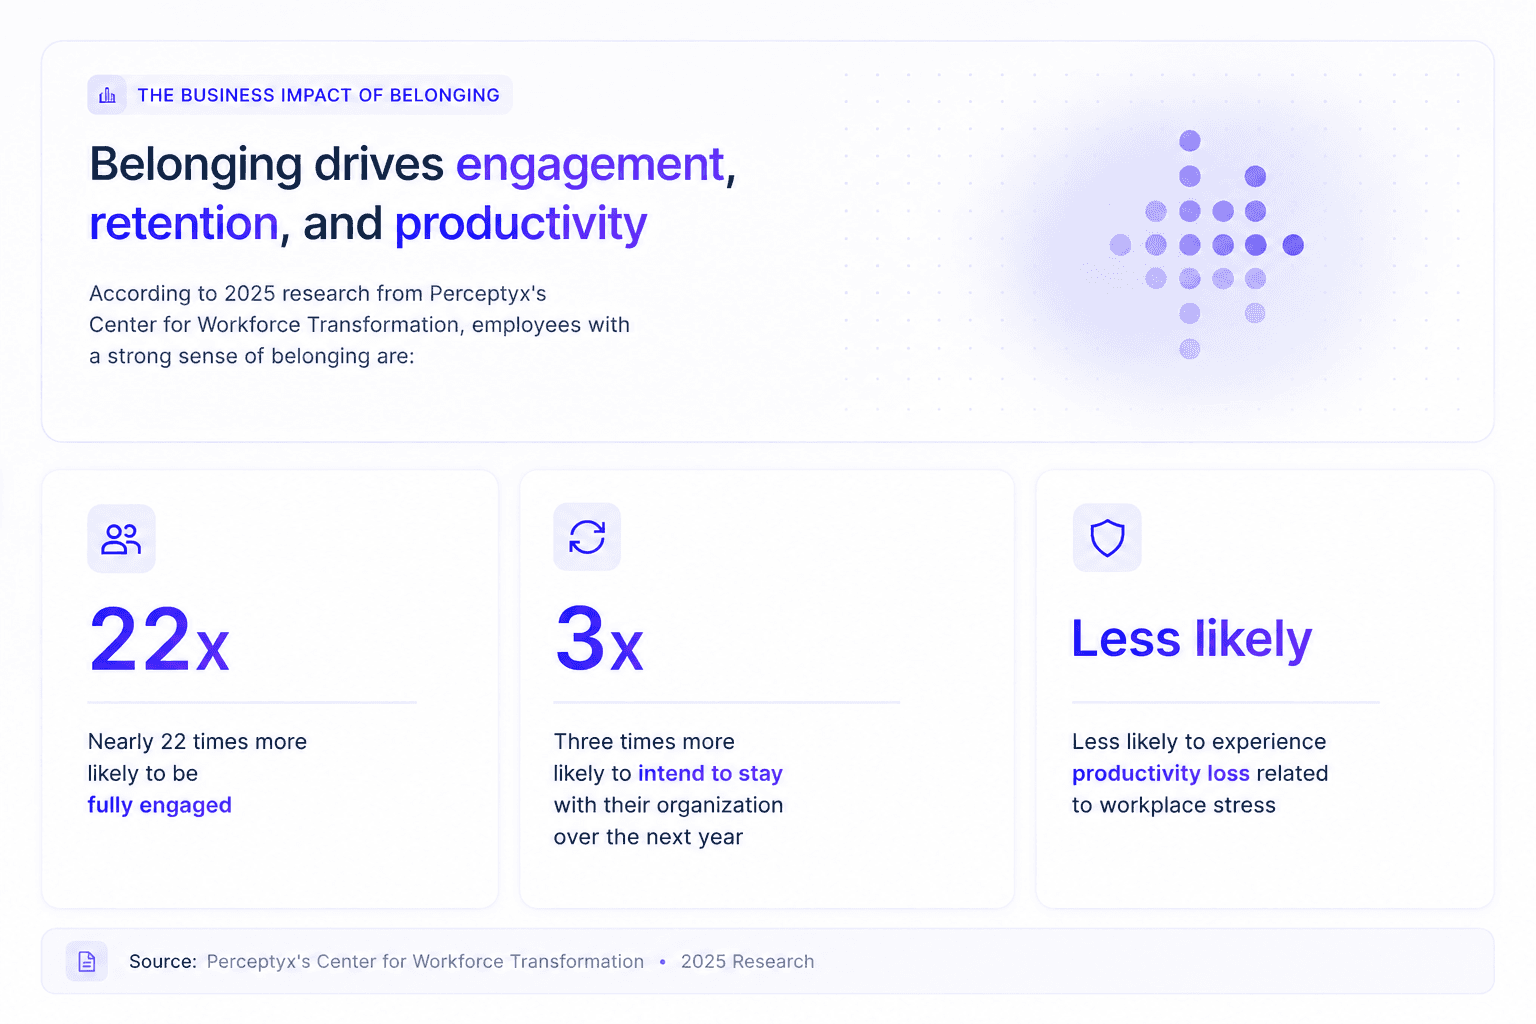
According to 2025 research from Perceptyx’s Center for Workforce Transformation, employees with a strong sense of belonging are:
Nearly 22 times more likely to be fully engaged
Three times more likely to intend to stay with their organization over the next year
Less likely to experience productivity loss related to workplace stress
Employees who don’t feel they belong are 1.8 times more likely to report that workplace stress affected their productivity for three or more days in the previous week.
For portfolio companies competing for specialized talent in sectors such as technology, healthcare, and financial services, belonging metrics can provide an early signal of emerging retention and productivity challenges. A company with strong financial performance and declining belonging scores may be developing a talent risk that has not yet appeared in turnover data or financial reporting.
4. Promotion Velocity and Pipeline Diversity
Promotion velocity measures whether a company is developing leadership internally or relying on external hiring to fill critical roles.
Organizations that consistently promote from within retain more institutional knowledge, create clearer career pathways, and reduce dependence on external recruitment. External senior hires often cost significantly more than internal promotions and introduce execution risk while new leaders ramp up.
Across your portfolio, promotion velocity can help you identify which companies are building sustainable leadership pipelines and which may be creating succession risks that will become more visible as they grow.
5. Compensation Positioning vs. Peers
The useful question is not whether compensation is competitive in absolute terms. It’s whether compensation is competitive for a specific role, level, and market.
A portfolio company might sit at the 90th percentile for base salary while ranking closer to the 40th percentile for equity participation in engineering roles. Aggregate compensation data would suggest the company is highly competitive. The engineers deciding whether to stay may see a different picture.
Compensation misalignment is one of the fastest-moving retention risks and one of the hardest to diagnose late. If compensation is out of step with the market in high-priority functions, you often won’t see the impact until replacement costs, productivity losses, and hiring challenges are already underway.
How to Compare Apples to Apples Without Forcing Tool Standardization
For operating partners, the goal is simple: a unified view of people performance across the portfolio. You want to see which companies are outperforming on manager effectiveness, which are showing early attrition warning signs, and which have compensation structures creating retention risk, without requiring every portfolio company to change its existing HR stack.
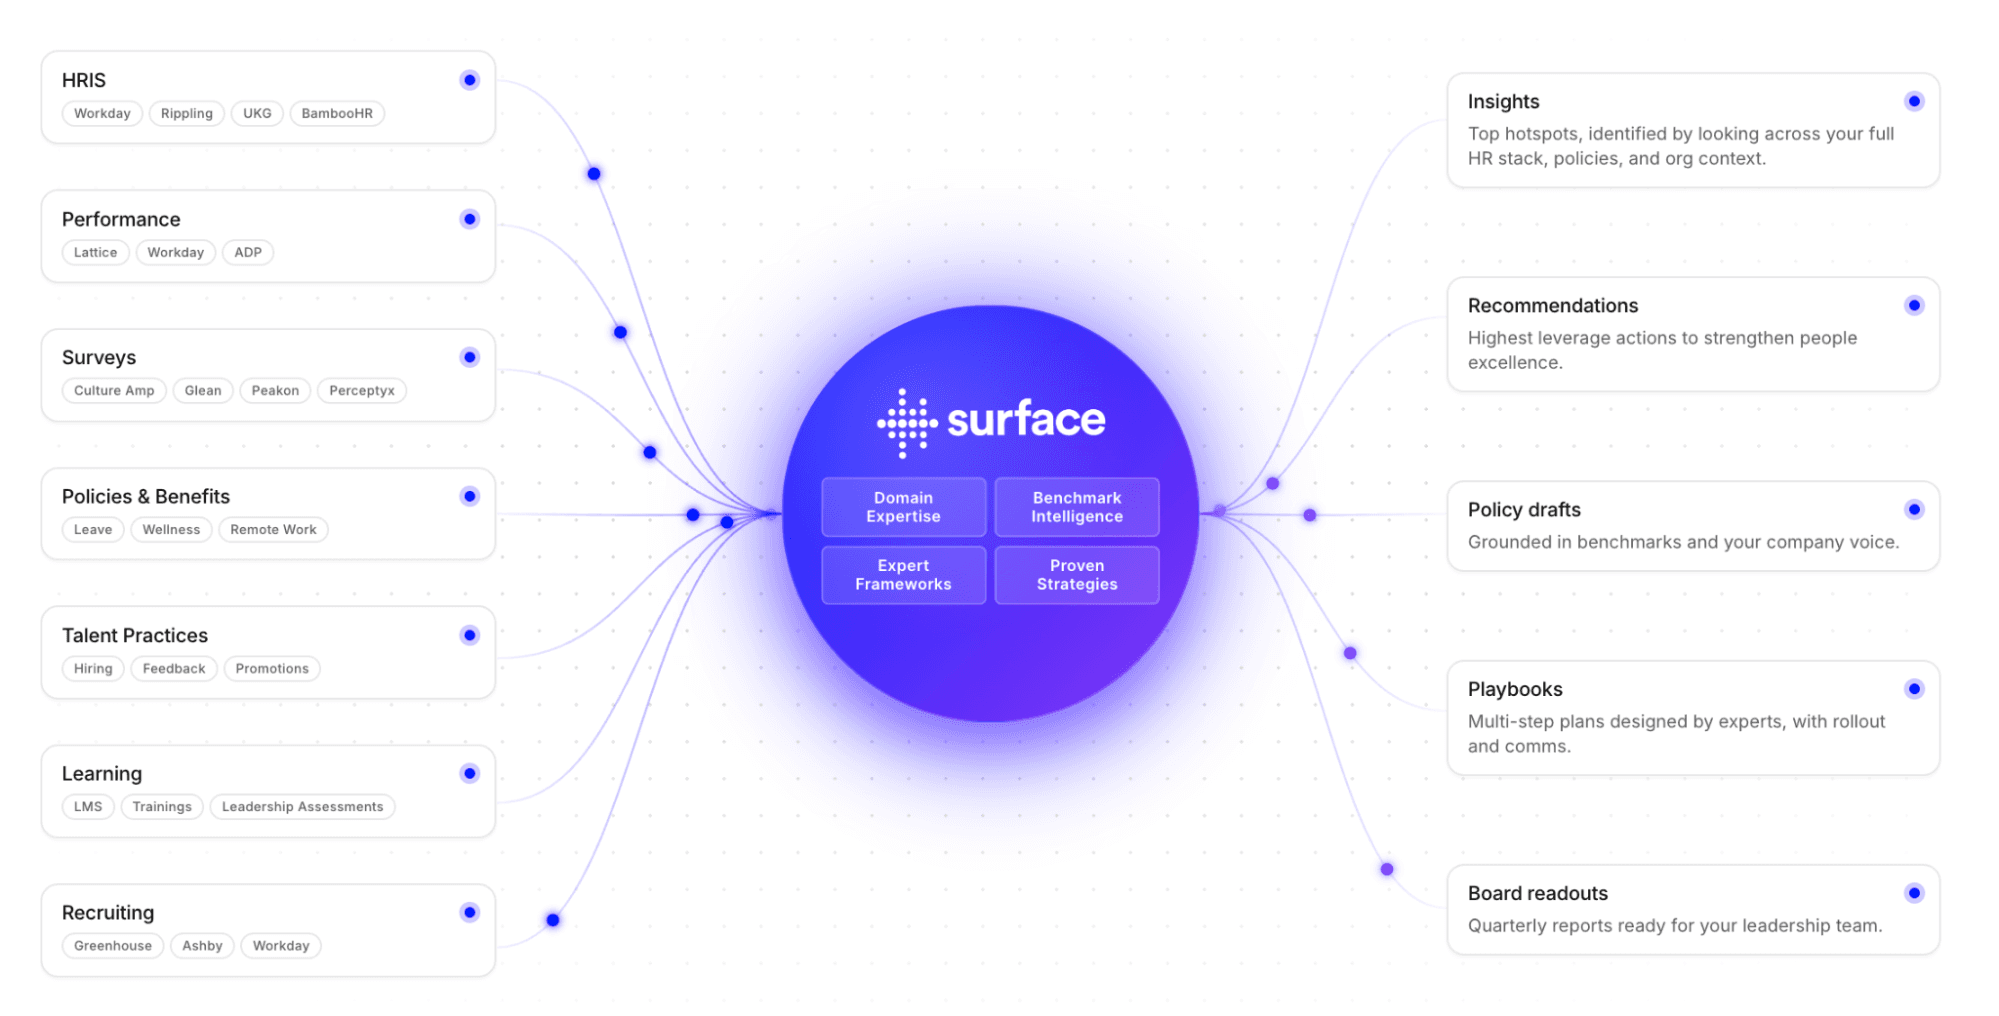
Surface solves the no-common-data-layer problem by sitting one layer above the individual HR stacks at each portfolio company. It integrates with whatever HRIS each company uses, whether that’s Rippling, Workday, BambooHR, or another platform, and normalizes the data into a consistent signal layer that makes cross-portfolio comparison possible.
The comparison is apples-to-apples because Surface handles the normalization, not because every company has been forced onto the same stack.
For portfolio company leadership teams, the benchmark view is equally valuable. A CPO who knows their belonging scores are 12 points below the portfolio median has a more compelling case for investment than one who only knows their absolute score. The comparison isn’t about ranking companies against each other. It’s about providing context for where improvement opportunities exist and what’s achievable.
One critical distinction: Surface does not require portfolio companies to share data with each other. Each company’s data stays private.
Cross-portfolio benchmarking draws on Paradigm’s proprietary dataset across thousands of organizations, not by pooling portfolio company data. Portfolio companies gain the benefit of external benchmarking without exposing their information to peers, addressing a common concern around data sharing and confidentiality.
When the Value Is Visible, the Conversation Changes
The $30,000 replacement cost figure is conservative and widely cited. Use it as a template for your own portfolio math.
A portfolio of ten companies with 400 employees each represents 4,000 employees. If preventable attrition is running 2% above peer benchmarks, that’s 80 avoidable departures per year. At $30,000 per replacement, the annual cost is $2.4 million.
That calculation doesn’t include the time operating teams spend collecting and normalizing people data across the portfolio. It doesn’t include consulting spend that can be displaced by ongoing benchmarking and reporting. And it doesn’t include the value of identifying people risks early enough to intervene before they affect execution, hiring, or retention.
When you can quantify the cost of people risk at the portfolio level, the investment conversation changes.
Operating Partners Checklist
Bring these questions into your next portfolio review, operating review, or board preparation discussion.
Attrition visibility:
Do you have attrition broken down by level, function, and tenure band, or just overall attrition?
Do you know your portfolio companies’ attrition rates relative to industry benchmarks, not just relative to each other?
Culture and engagement:
What engagement or culture data exists across the portfolio, and is any of it comparable across companies?
Do your portfolio companies’ boards receive people metrics alongside financial metrics?
Leadership and management:
Which portfolio companies have the most critical leadership gaps, and how are you identifying them?
What’s the manager effectiveness baseline across the portfolio, and how does it vary?
Cross-portfolio comparison:
If a portfolio company is underperforming on talent retention, how quickly can you identify whether it’s a compensation problem, a culture problem, or a management problem?
What would change in your quarterly operating reviews if you had cross-portfolio people benchmarks as reliable as your financial benchmarks?
Surface Is Your Portfolio Intelligence Layer
The question that surfaced repeatedly in conversations with operating partners was simple: “Can you compare portfolio companies on people metrics without forcing everyone onto the same HR platform?”
Today, the answer is yes.
Surface gives PE operating partners the cross-portfolio people visibility that financial data has always provided: consistent, comparable insight without requiring portfolio companies to standardize their HR tools.
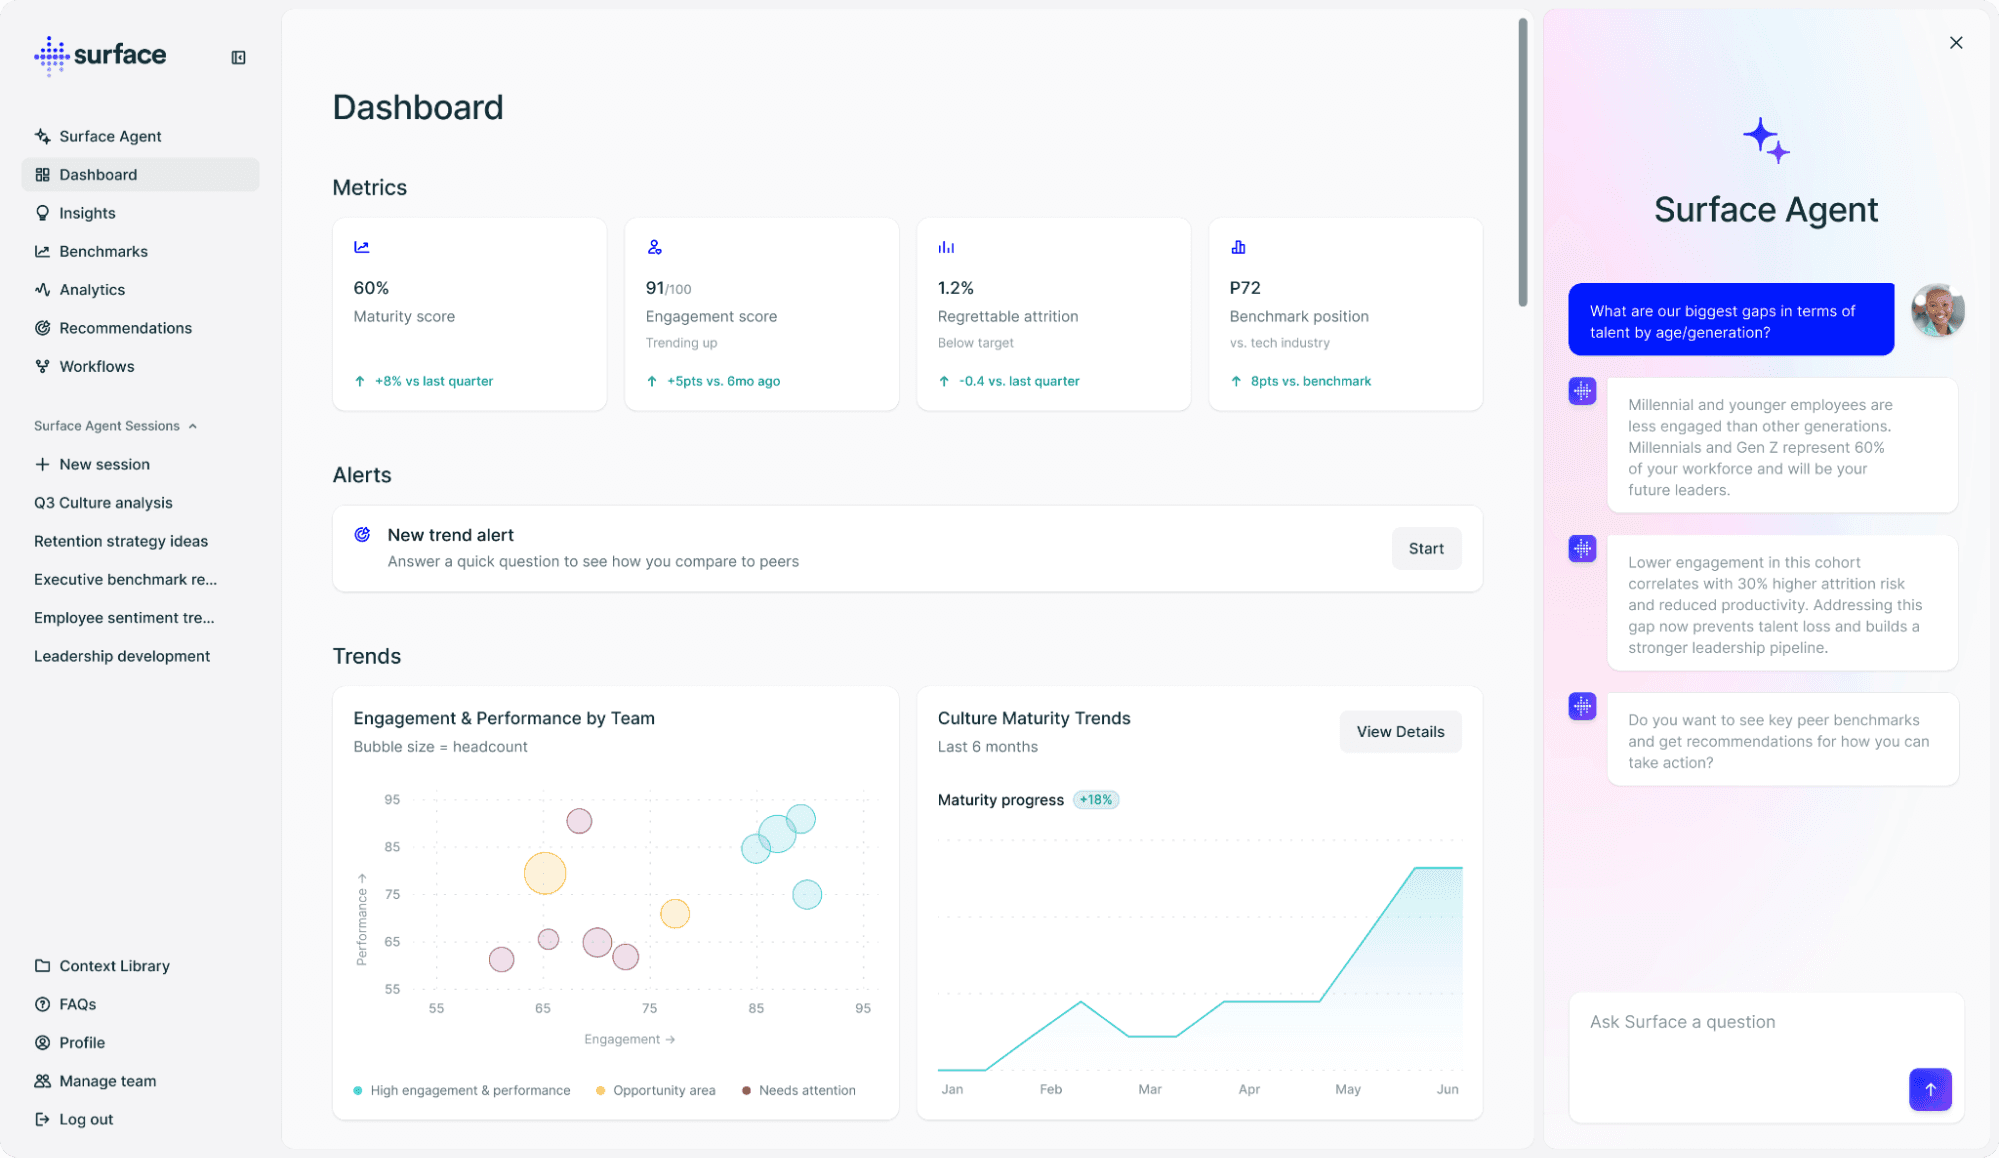
Surface sits above the existing HR stack at each portfolio company, normalizing people data into a common signal layer that makes cross-portfolio comparison possible. The result is earlier visibility into avoidable attrition, emerging leadership risks, compensation misalignment, and the people factors that influence operational performance.
The benchmark foundation is Paradigm’s 12+ years of consulting data across thousands of organizations. Portfolio companies aren’t just compared against each other. They’re benchmarked against peer organizations calibrated to their industry, size, and growth stage.
For portfolio companies where relative performance data requires discretion, reporting can be configured so each company sees its own benchmarks without visibility into specific peer data.
Implementation is straightforward. Each portfolio company onboards to Surface in 14 days, and the operating partner view is available from the first reporting cycle.
This is a different kind of portfolio management capability, one that’s been largely missing from the PE toolkit until now. Instead of discovering people issues after they affect performance, you can benchmark, prioritize, and address them at the portfolio level before they become operational problems.
See Surface in action. Book a walkthrough for your portfolio.

Paradigm
Paradigm helps organizations solve their hardest people and culture challenges, through expert consulting and advisory work and Surface, our talent and culture intelligence platform.
View all articles
Newsletter
Expert perspectives on workplace culture, in your inbox
Keep reading
More insights

Employee Listening & Culture Data
Manager Effectiveness: How to Diagnose Where Your Managers Are Stuck
Learn how to identify manager effectiveness gaps using connected workforce signals, before they show up as exits. A diagnostic framework for CHROs and CPOs.

Employee Listening & Culture Data
Dashboards vs. Decisions: When to Use a People Analytics Platform—and When You Need Surface
People analytics platforms show what's happening. Surface shows you what to do about it. A framework for HR leaders who need both and know the difference.
Employee Listening & Culture Data
Portfolio Intelligence: The People Metrics Private Equity Firms Should Be Monitoring
PE firms monitor financial performance across the portfolio. Most don't have the same visibility on people metrics. Here's the framework and why it matters.