
News & Press
New Blueprint Analytics Illustrate How Hiring and Attrition Impact Culture
Natalie Johnson
·

You might understand the diversity of your organization today, but what will it look like in six months? Are employees from underrepresented backgrounds leaving your team at a higher rate than they’re joining? And what specific levers can you pull to have the most significant impact on representation? With our latest Paradigm Blueprint features, organizations can quickly answer these questions.
After working with more than 1,000 companies on diversity, equity, and inclusion (DEI) programs, we know how challenging it can be to track diversity metrics in real-time. As a result, many organizations don’t understand their key barriers in time to meaningfully address them.
That’s why we’re thrilled to release new updates to Blueprint — our DEI analytics and strategy platform — that give organizations a more holistic view of the data that shapes their workforce.
Specifically, we’ve made improvements to our analytics functionality to allow customers to track dynamic hiring and attrition data, and understand how those data affect your overall employee representation. This allows organizations to stop making decisions based on incorrect hypotheses and prioritize the areas that will have the most impact. For example, organizations often assume that the key barrier to diversity is in hiring. Our new dashboards help organizations uncover when attrition may actually be a much more significant challenge.
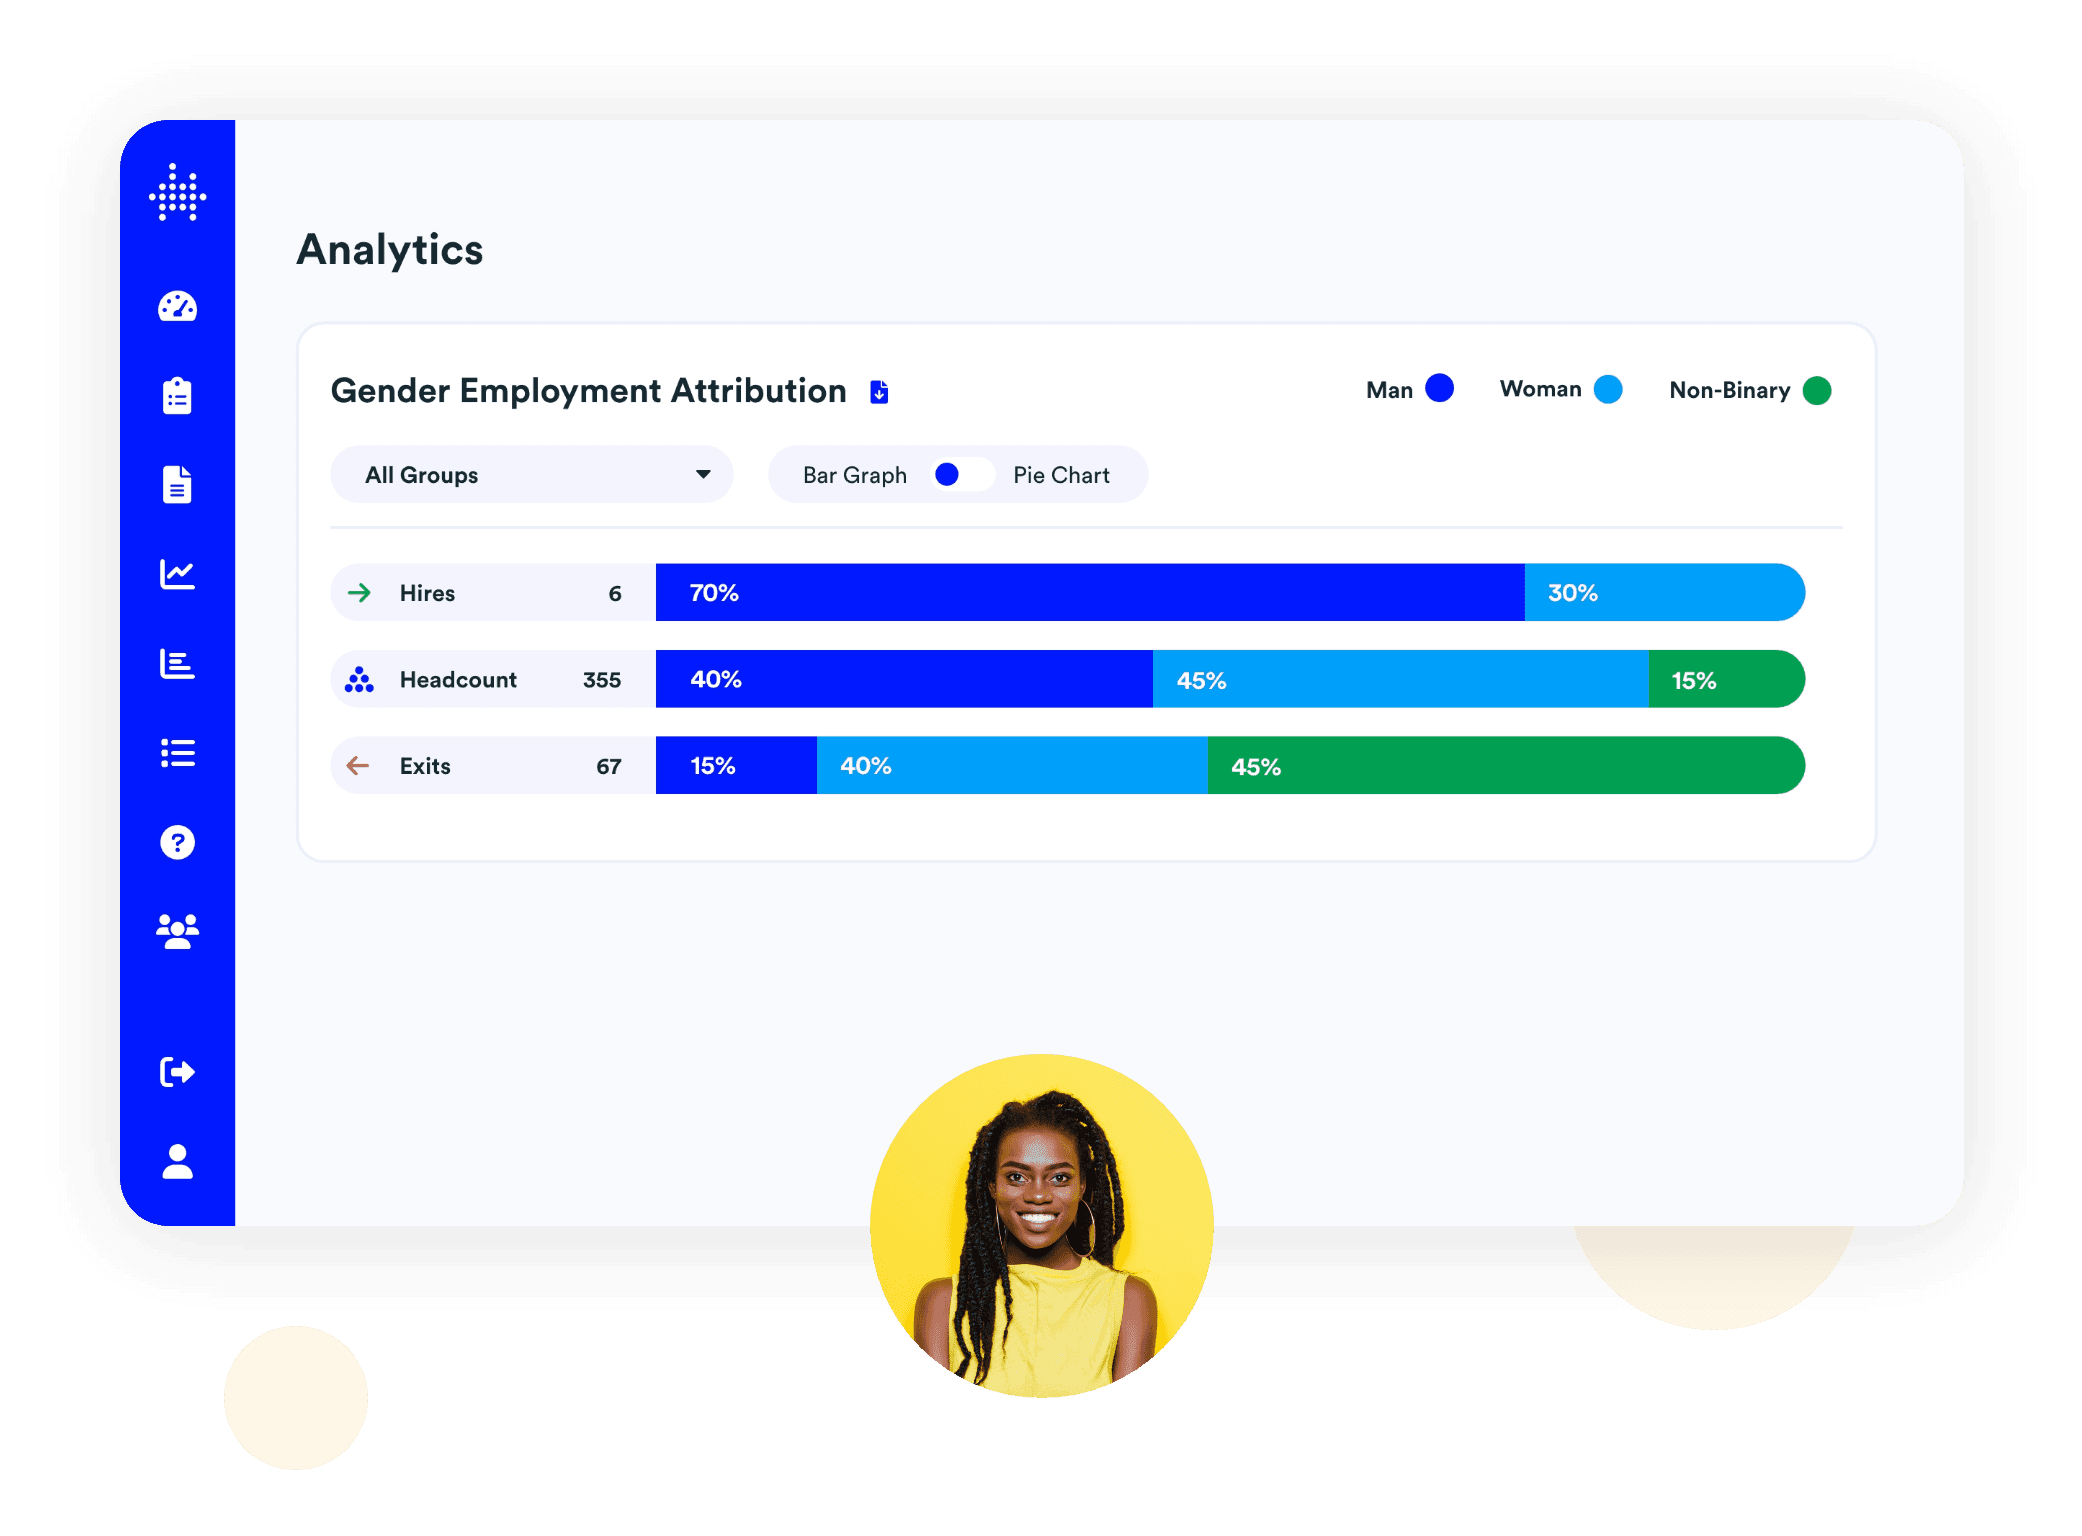
For example, if you set a goal to increase representation of Black employees by 5% in engineering in the U.S., Blueprint will show you where you are today and how your recent hiring and attrition patterns will affect your progress.
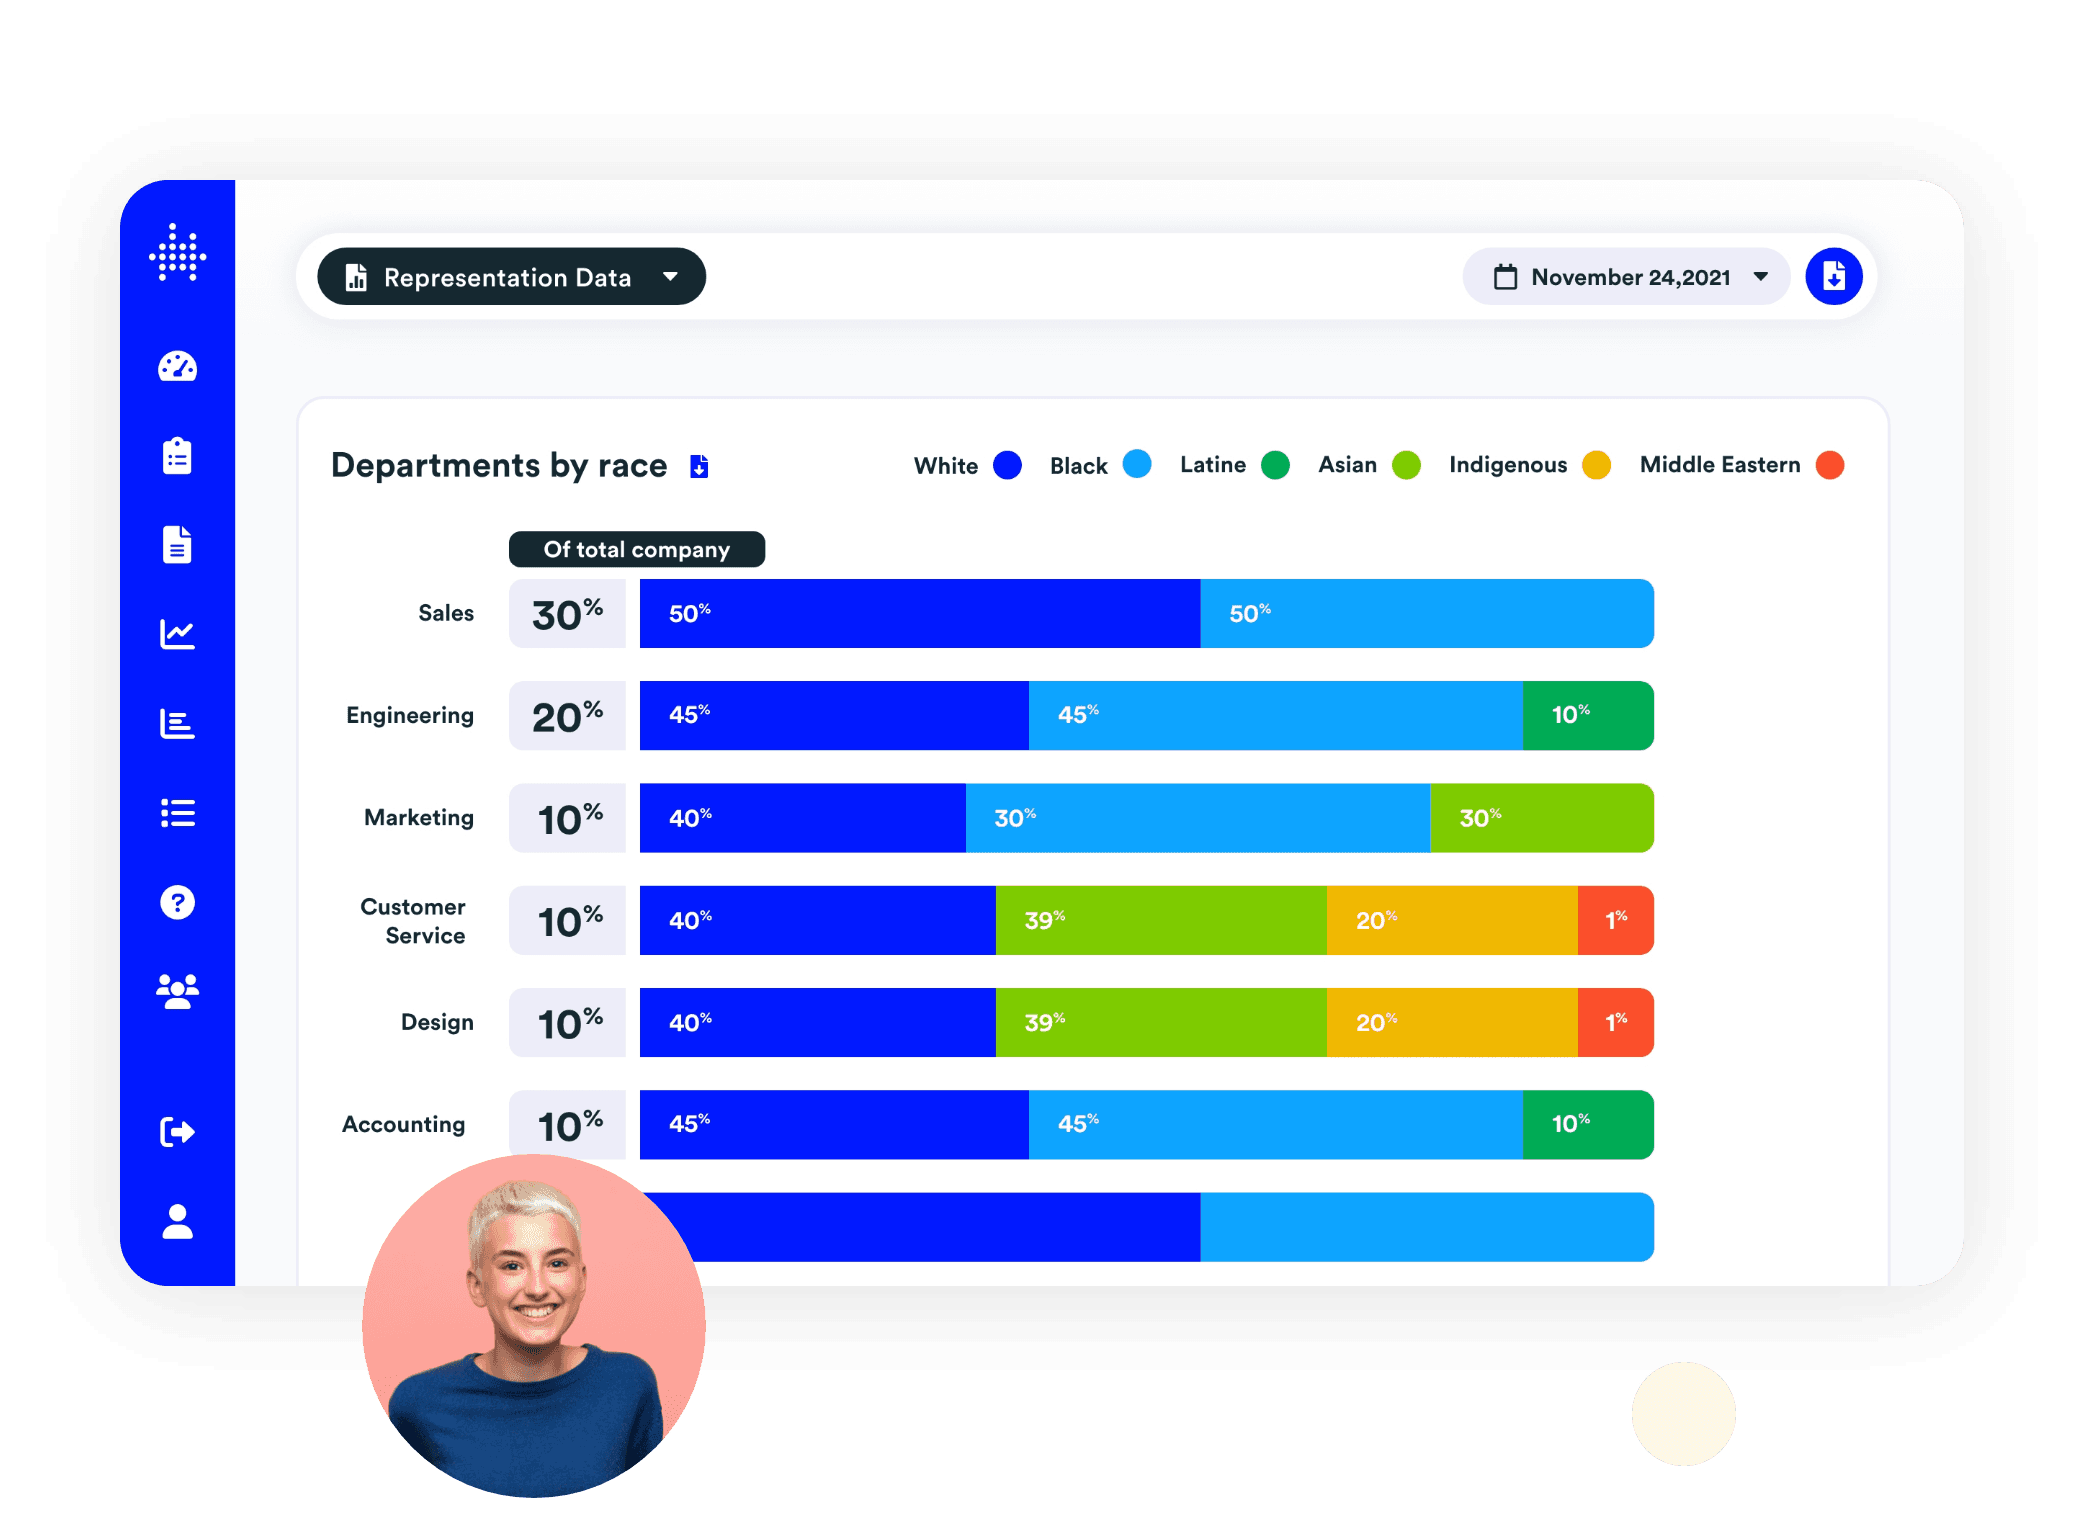
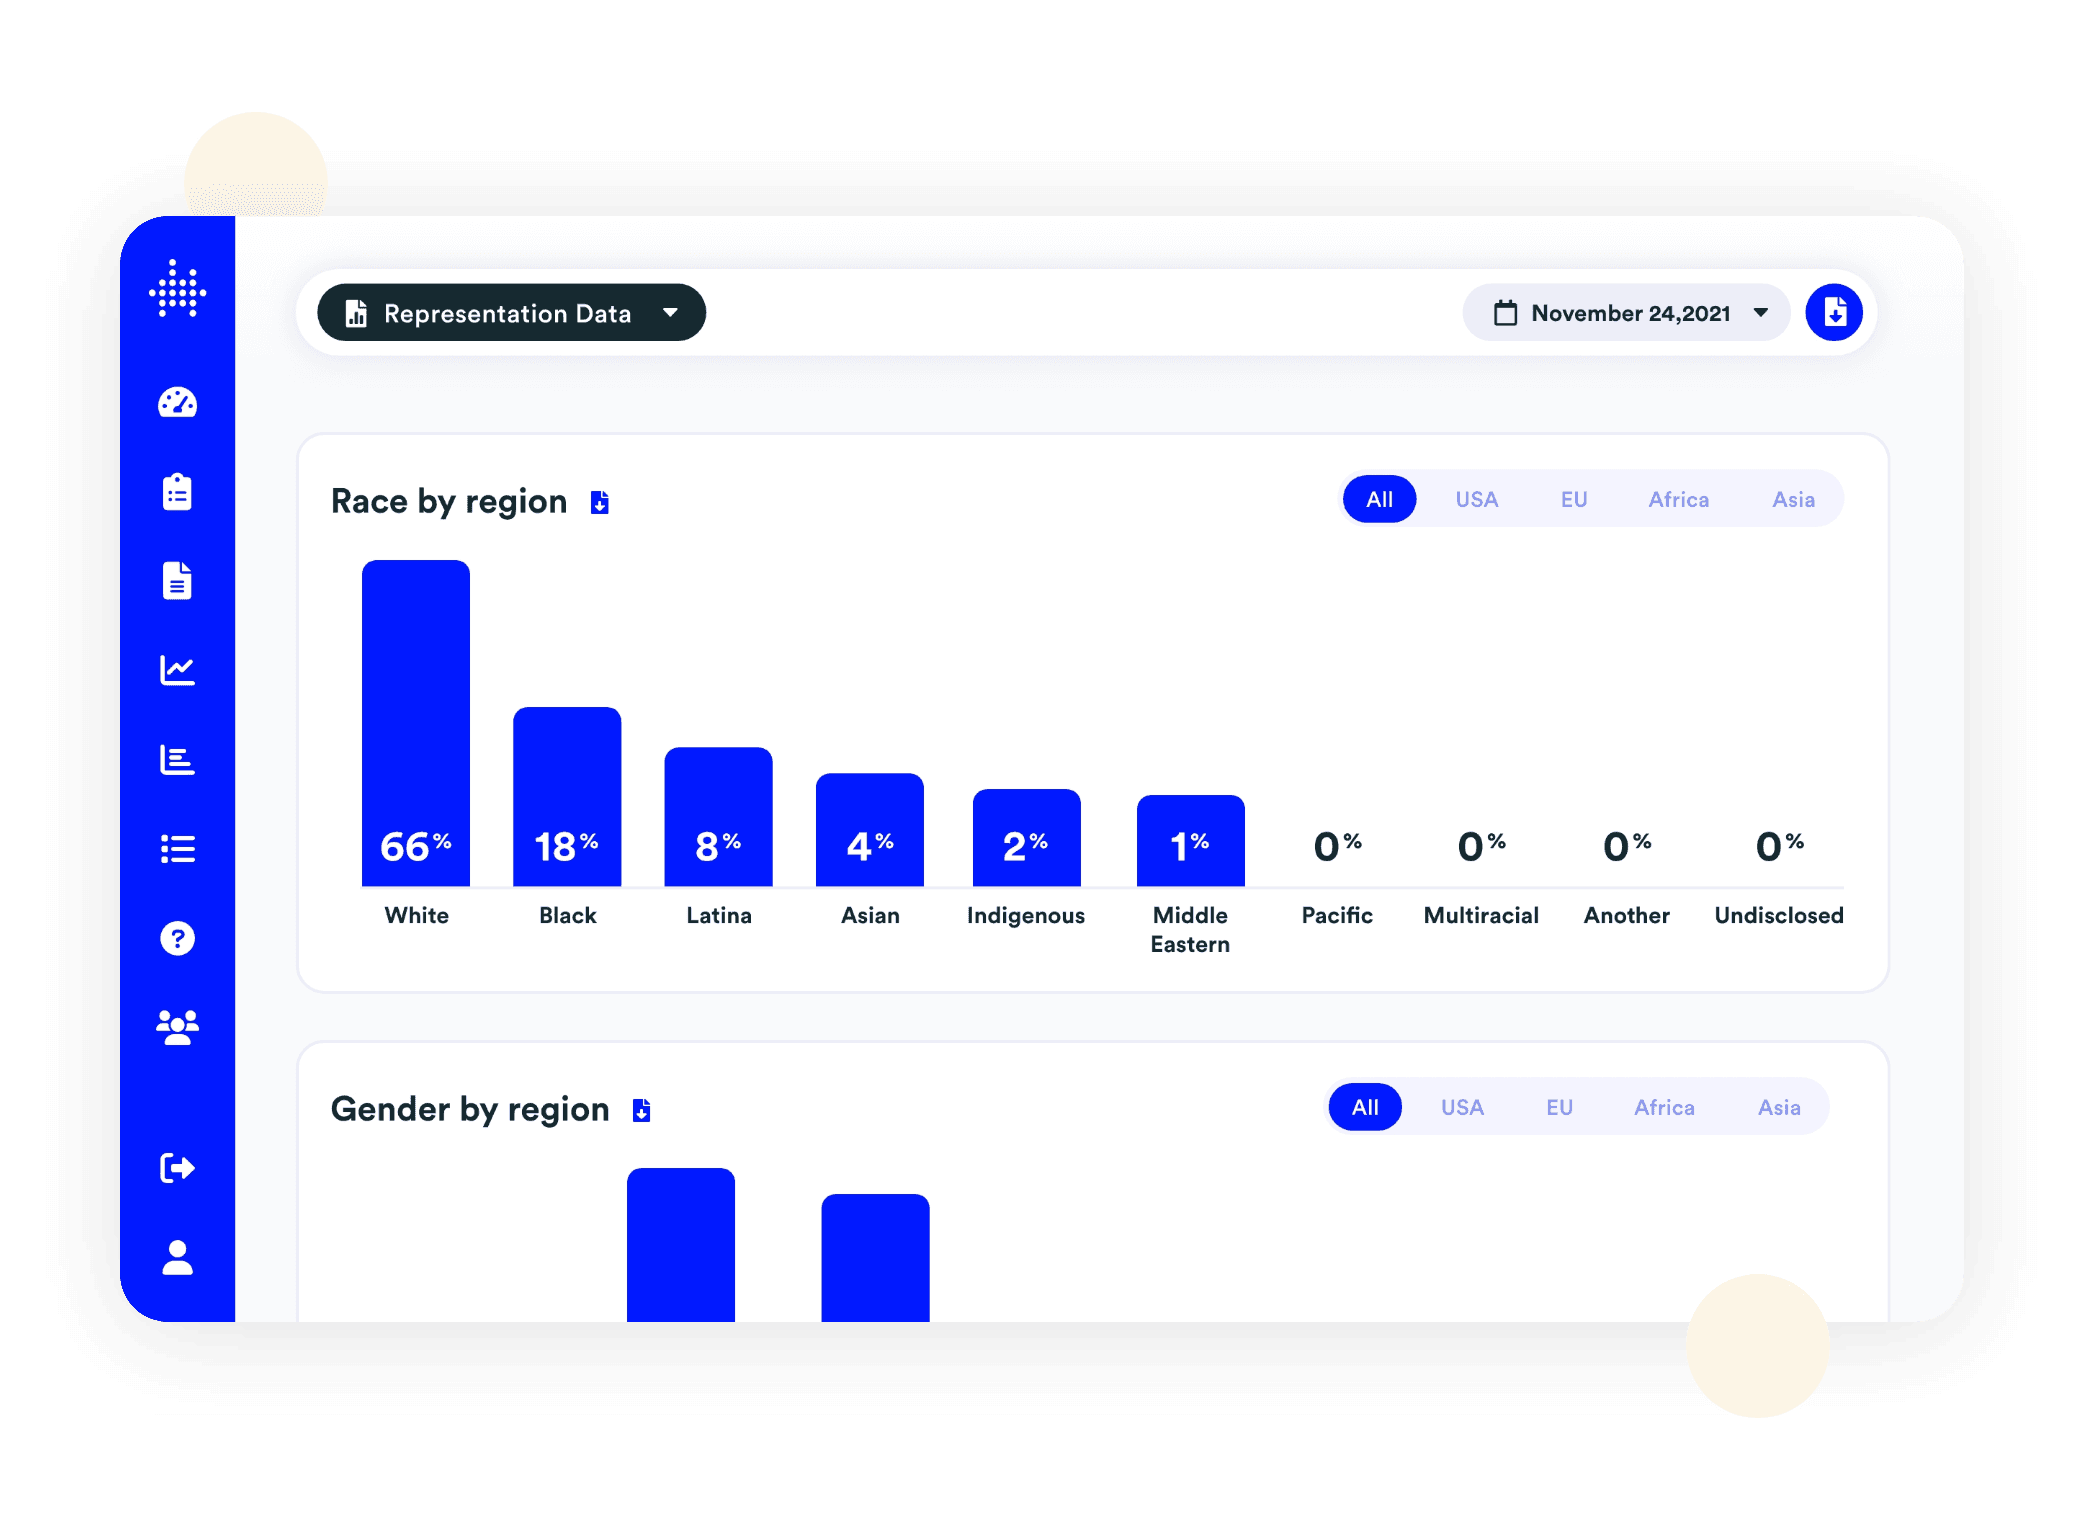
Customers can also get more granular looks at DEI data by region, job level, and function.
Making DEI Data More Accessible
Blueprint is designed to make hiring, attrition, and representation data easy to understand with clear graphs and helpful data visualization: no more sorting through lines of HRIS and ATS exports to build your own dashboards.
Blueprint not only crutches the numbers for you, its dashboards can be regularly updated as your organization evolves.
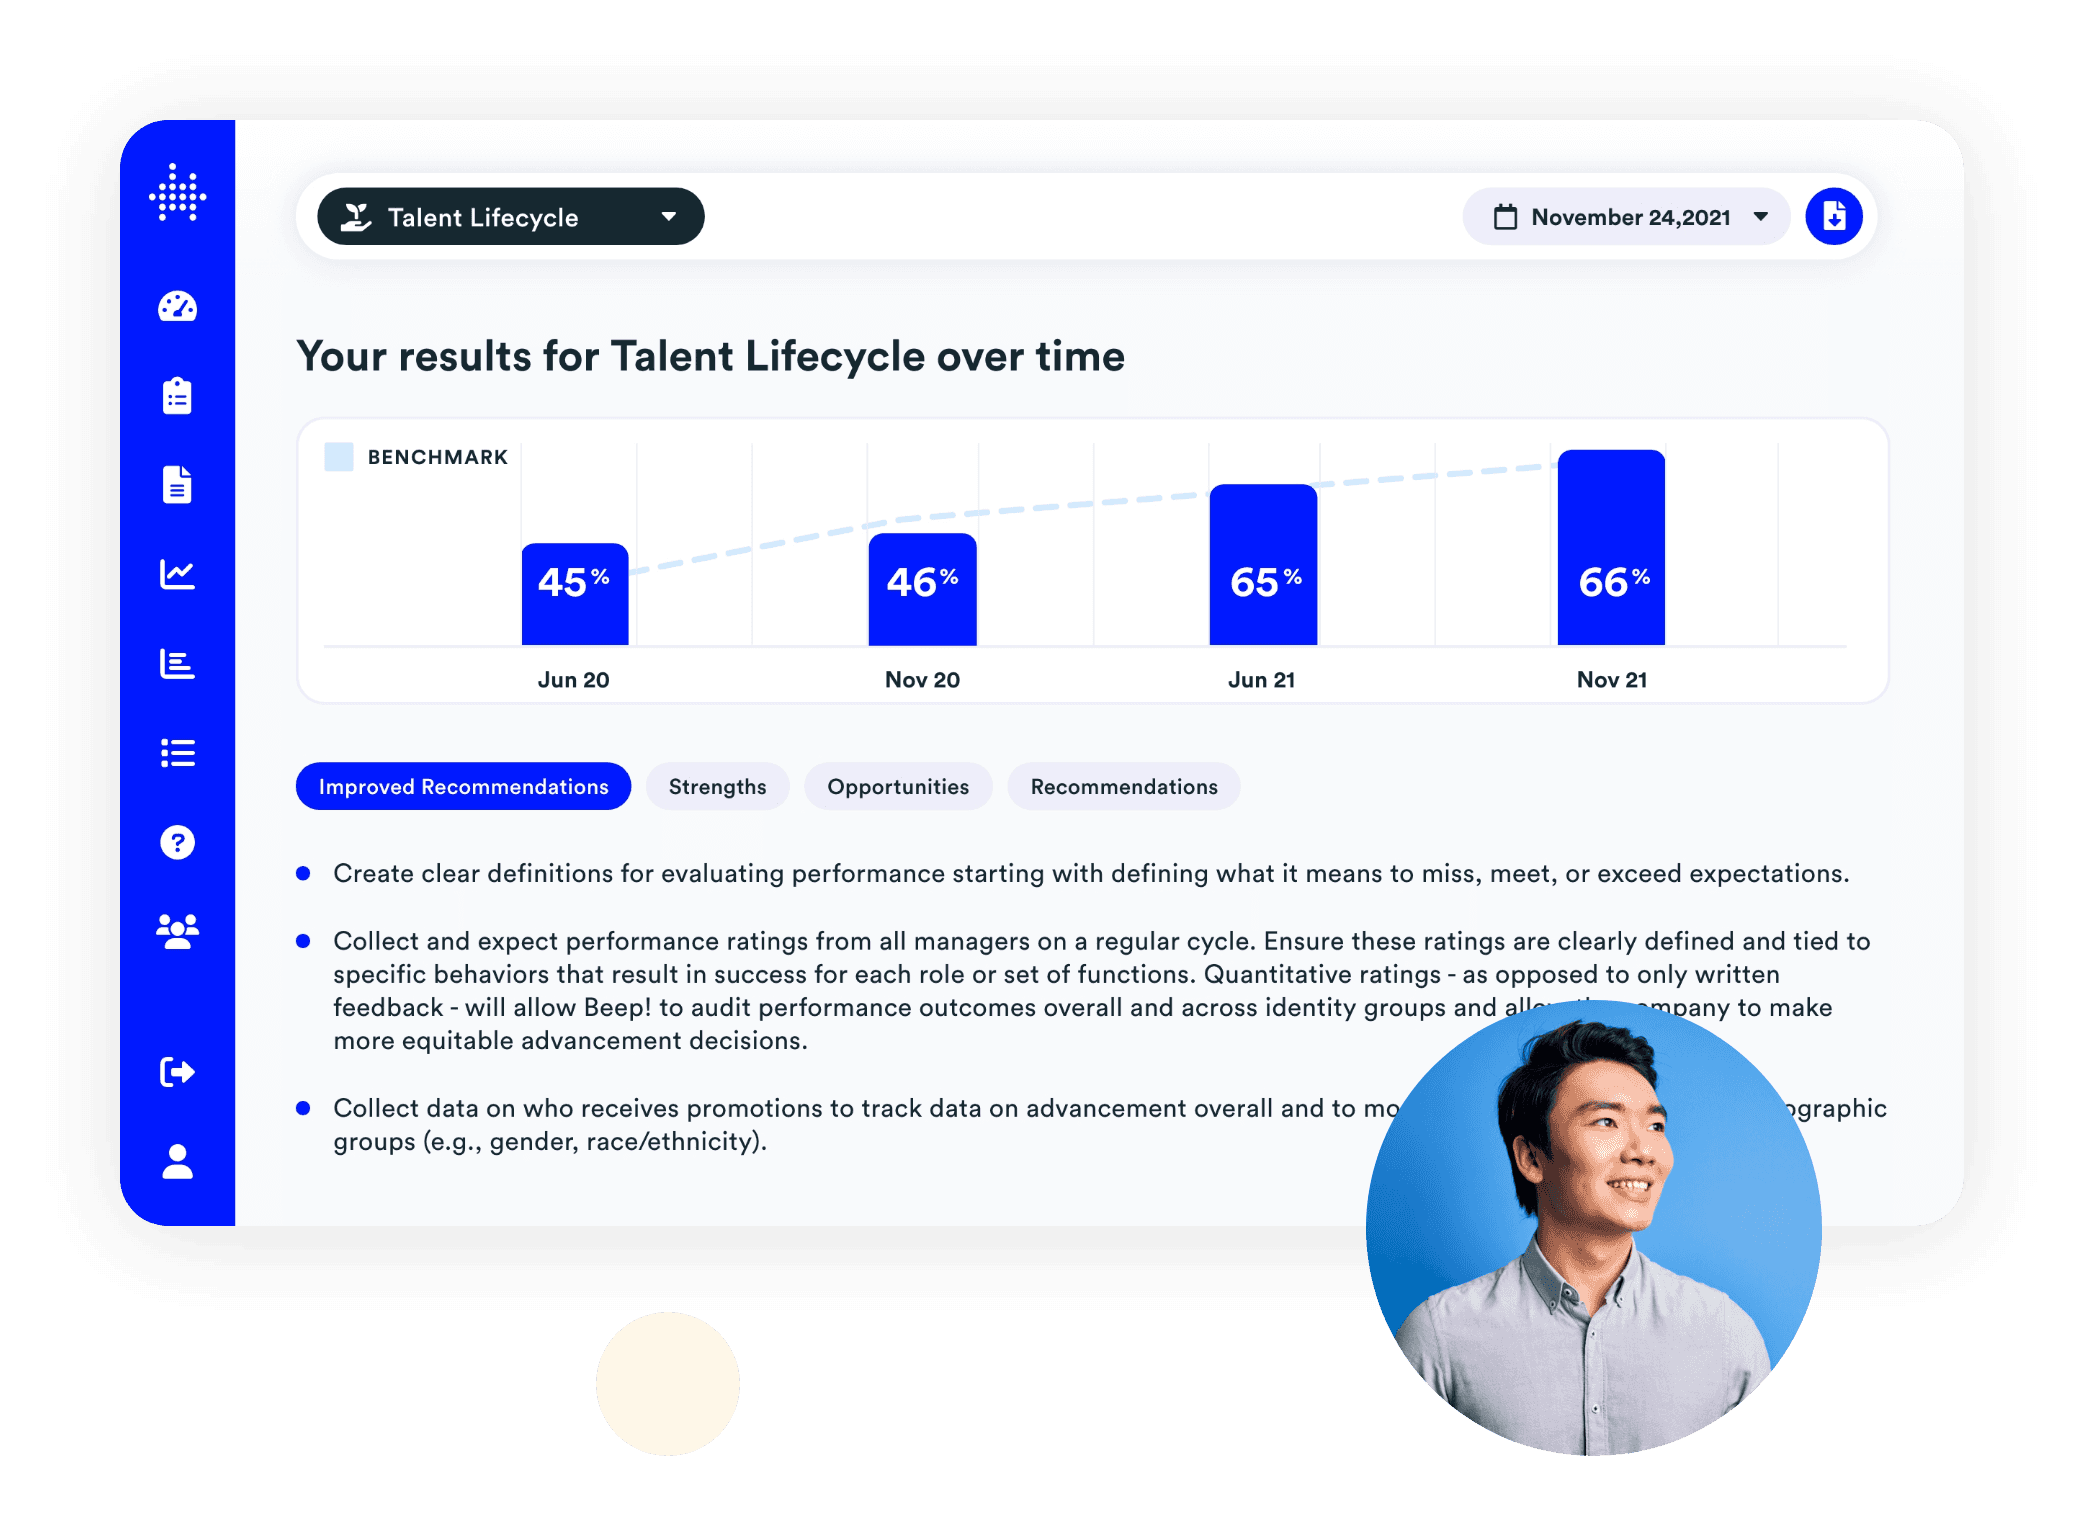
Alongside this improved analytics functionality, Blueprint continues to offer a DEI maturity assessment that provides customers with scores and benchmarking on key domains of inclusion, providing DEI leaders a single platform to evaluate their efforts, prioritize initiatives that will drive the most impact, and measure progress.
We’re thrilled we can make this data-driven approach to DEI more accessible for companies, and are looking forward to rolling out more exciting Blueprint features this year!

Natalie Johnson
Paradigm helps organizations solve their hardest people and culture challenges, through expert consulting and advisory work and Surface, our talent and culture intelligence platform.
View all articles
Newsletter
Expert perspectives on workplace culture, in your inbox
Keep reading
More insights

Employee Listening & Culture Data
Manager Effectiveness: How to Diagnose Where Your Managers Are Stuck
Learn how to identify manager effectiveness gaps using connected workforce signals, before they show up as exits. A diagnostic framework for CHROs and CPOs.

Employee Listening & Culture Data
Dashboards vs. Decisions: When to Use a People Analytics Platform—and When You Need Surface
People analytics platforms show what's happening. Surface shows you what to do about it. A framework for HR leaders who need both and know the difference.

Employee Listening & Culture Data
Portfolio Intelligence: The People Metrics Private Equity Firms Should Be Monitoring
PE firms monitor financial performance across the portfolio. Most don't have the same visibility on people metrics. Here's the framework and why it matters.